Table
Tables support all basic formatting options like borders, rounded corners, and styling. But they also have extra features tailored for templating your reports that we will cover in this section.
Manipulating cells (merge, split, color..)
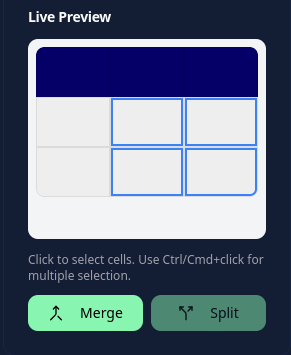
On the live preview you can click to select cells, and shift/ctrl/cmd click to select multiple cells at the same time. When you selected multiple adjacent cells you will be able to merge them. You can also do the inverse operation to split cells.
Color
When you select cells you can change their color, and by using liquidJS use dynamic colors. 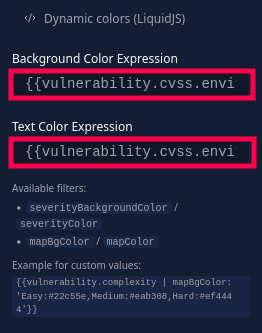 Examples: Map custom colors based on a list selection (complexity):
{{vulnerability.complexity | mapBgColor: 'Easy:#22c55e,Medium:#eab308,Hard:#ef4444'}}Use CVSS severity colors:
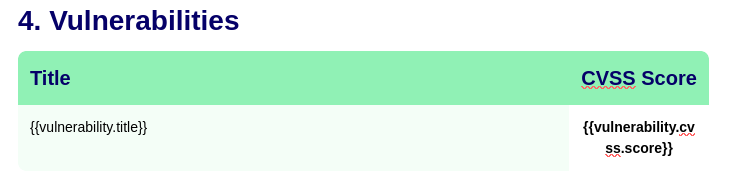
Background color:
{{vulnerability.cvss.score | backgroundColor}}

Text color:
{{vulnerability.cvss.score | textColor}}
Row loop
You can create loop on your cells, loops will be applied on the entire row of selected cells. It will create new cells for each loop in the table 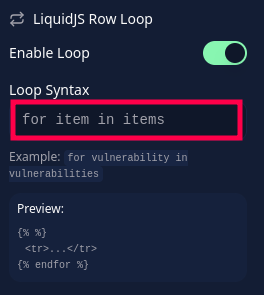 After activating the option, you will see the repeat emoji on the looped rows:
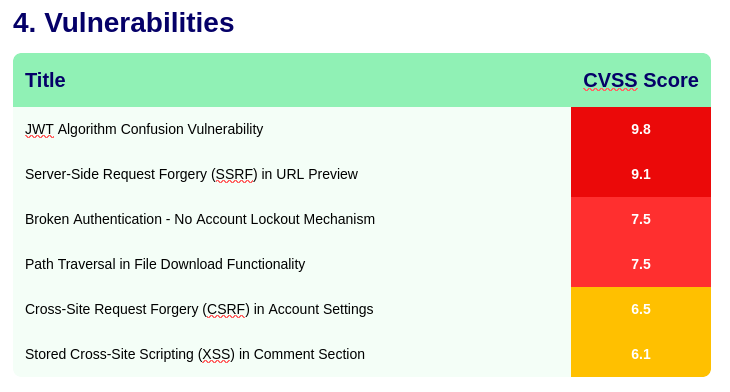
Example: Create a row for each vulnerability sorted from highest CVSS score to lowest
for vulnerability in vulnerabilities | sort_by: "cvss.score" | reverse| Template | Preview |
|---|---|
 |  |
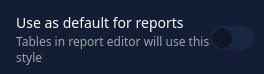
Customizing default report tables
In your reports, you can add tables through the richtext editor. By default these tables style are very standard, if you want to adapt them to your design it's possible by selecting a reference table in your template which you want the design to be copied (headers and cells) for all the tables inserted in your report.