

Client Portal Remediation Statistics
The Statistics page brings together data from the reports published in the Client Portal. Clients can use it to review their security posture, follow remediation, and compare assessment activity over time.
Summary
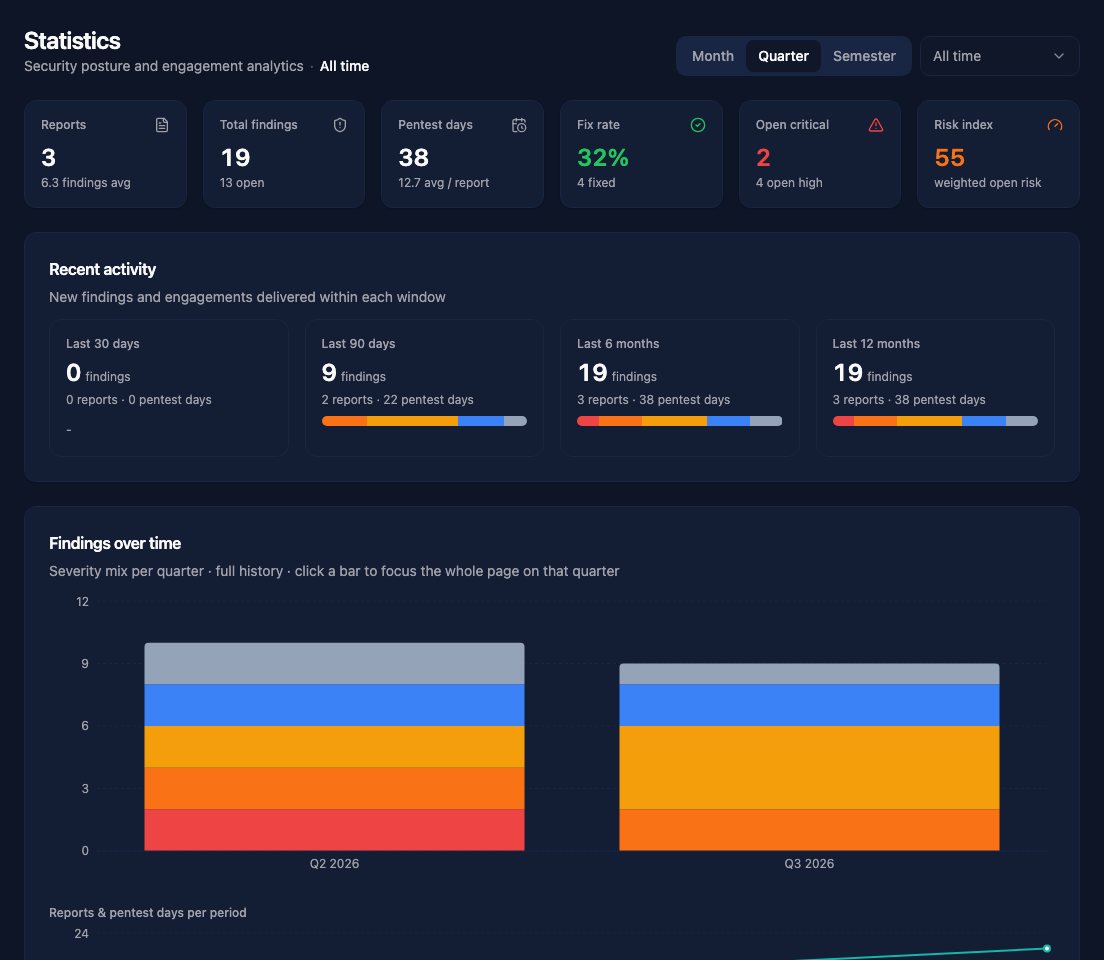
The cards at the top of the page show the number of reports and findings, total pentest days, fix rate, open critical findings, and the current risk index.
On this page, Fix rate counts both Fixed and Accepted Risk findings as resolved. The dashboard and individual report pages count only Fixed, so their percentages can differ. Risk index is a severity-weighted total of open findings.
With All time selected, recent activity shows the last 30 days, 90 days, 6 months, and 12 months. Each period includes the number of findings, reports, pentest days, and the severity distribution.
Findings over time
The findings chart groups vulnerabilities by month, quarter, or semester. Select a period from the top right of the page to focus the statistics on that period.
Findings are grouped by their report's assessment end date, with publication or other report dates used when an end date is missing. The chart does not track the date each finding was discovered or fixed.
You can also click a bar in the chart. The other sections on the page will use the same period while the full chart remains visible for context.
Remediation and severity
The severity distribution shows how findings are split between Critical, High, Medium, Low, and Informational. The remediation section uses the same statuses found on the dashboard and vulnerability pages.
These sections help clients see whether risk is decreasing and how much remediation work remains.
Assessment details
Statistics are grouped by assessment type and vulnerability category. This makes it easier to identify which types of engagement produce the most findings and which categories appear most often.
The engagements table lists the published reports included in the current period. It shows the assessment dates, number of pentest days, findings, fixed findings, and severity mix.
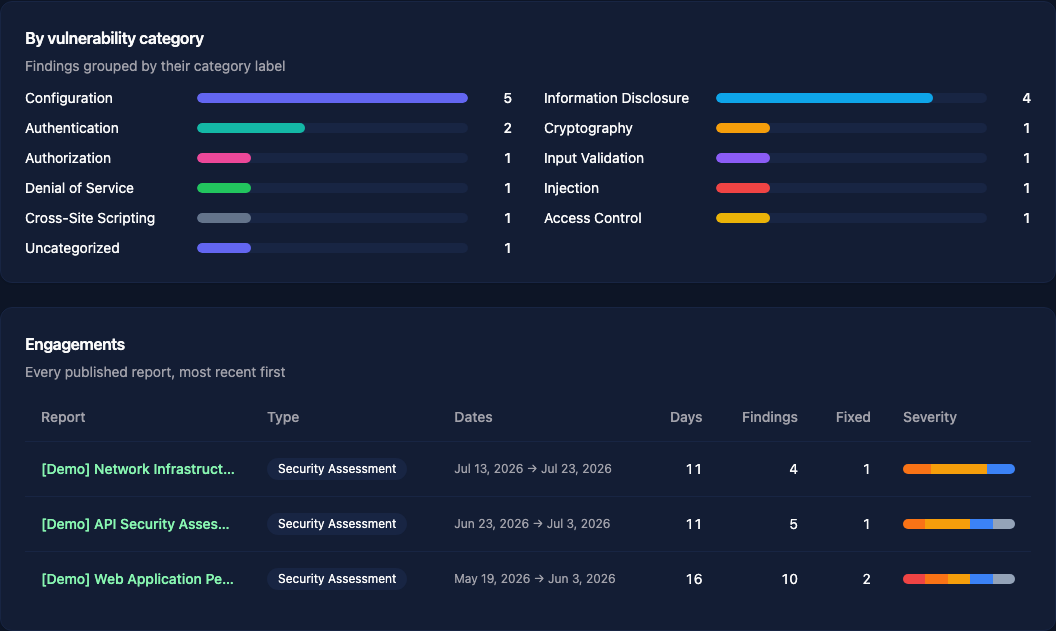
Select a report name to open the corresponding engagement.